|
Statewide, the 10 cities and communities with the greatest median home price increases in March
2002 compared to the same period a year ago were:
|
Culver City |
58.1% |
| South Pasadena |
51.9% |
| Los Alamitos |
43.6% |
| La Verne |
42.0% |
| Big Bear |
38.9% |
| Placerville |
36.6% |
| Twenty-nine Palms |
34.9% |
| West Hollywood |
34.2% |
| Paramount |
32.4% |
| Solana Beach |
31.5% |
|
|
 |
|
|
|
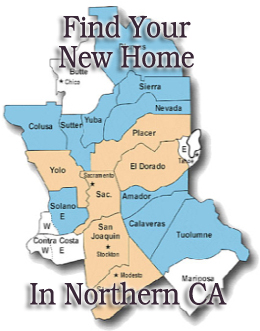
EQUITY ZONES of Northern California
|
|
|
COMPARE CA PRICES 2002
|
|
|
|
 |
|
|
Sales, median home price in California surge
Nearly 30 percent in April 2002 to new records
|
|
LOS ANGELES (May 28) - Sales of existing homes in California in
April increased 29.8 percent and the median home price rose 26.1 percent compared to the same period a year ago, the California
Association of REALTORS(R) and Real Estate Solutions, a real estate information service, reported today.
"Residential real estate in California, particularly in the San
Francisco Bay Area, continued to rebound aggressively last month compared to 2001," said C.A.R. President Robert Bailey. "Sales
in the San Francisco Bay Area increased 73 percent in April compared to a year ago and surged nearly 120 percent in Santa
Clara.
"At $321,950, the median price of a home in California topped $300,000
for a second time last month," he said. "Both sales and the median home price hit new records in April. With only a two-month
supply of homes for sale throughout the state, there simply isn't enough inventory available to meet the demand for homes."
Closed escrow sales of existing, single-family detached homes in
California totaled 643,030 in April at a seasonally adjusted annualized rate, according to information collected by C.A.R.
from more than 90 local REALTOR® associations statewide. Statewide home resale activity increased 29.8 percent from the 495,390
sales pace recorded in April 2001. Resale activity posted an increase of 9.7 percent in
April compared to March.
The statewide sales figure represents what the total number of
homes sold during 2002 would be if sales maintained the April pace throughout the year. It is adjusted to account for seasonal
factors that typically influence home sales.
The median price of an existing, single-family detached home in
California during April 2002 was $321,950, a 26.1 percent increase over the $255,310 median for April 2001, C.A.R. reported.
The April 2002 median price increased 5.2 percent compared to March 2002.
"Low inventory, favorable mortgage interest rates and rapidly rising
home price appreciation will continue to intensify the pace of home sales in the coming months," said C.A.R. Vice President
and Chief Economist Leslie Appleton-Young.
Highlights of C.A.R.s resale housing figures for April 2002:
-
C.A.R.s Unsold Inventory Index for existing, single-family
detached homes in April 2002 was 2.0 months, compared to 4.0 months for the same period a year ago. The index indicates the
number of months needed to deplete the supply of homes on the market at the current sales rate.
-
Thirty-year fixed mortgage interest rates averaged 6.99 percent
during April 2002, down from 7.08 percent in April 2001, according to the Federal Home Loan Mortgage Corp. Adjustable mortgage
interest rates averaged 4.96 percent in April 2002 compared to 6.11 percent in April 2001.
-
The median number of days it took to sell a single-family
home was 26 days in April 2002, unchanged from the same period a year ago.
Regional MLS sales and price information is contained in the tables that accompany
this press release. Regional sales data is not adjusted to account for seasonal factors that can influence home sales. The
MLS median price and sales data for detached homes is generated from a survey of more than 90 associations of REALTORS© throughout the state. MLS median price and sales data for condominiums is based on a survey of 64 associations.
The median price for both detached homes and condominiums represents closed escrow sales.
In a separate report covering more localized statistics generated by C.A.R.
and Real Estate Solutions' MetroScan(R) service, 261 of 304 California cities and communities showed an increase in their
respective median home prices from a year ago.
Using the MetroScan(R) database, median home prices are generated from new
and existing condominium and single-family closed escrow sales. These localized MetroScan© statistics
are based on county records data rather than MLS information.
Note: Large changes in
local median home prices typically indicate both local home price appreciation, and often, large shifts in the composition
of housing market activity. Some of the variations in median home prices may be exaggerated due to compositional changes in
housing demand.
Among the highlights of the April localized data collected by C.A.R. and Real
Estate Solutions:
Statewide, the 10 cities and communities with the highest median home prices
in California during April 2002 were:
The California Association of REALTORS® is one of the largest state trade
organizations in the United States, with more than 90,000 members dedicated to the advancement of professionalism in real
estate. C.A.R. is headquartered in Los Angeles.
APRIL 2002 REGIONAL SALES AND PRICE ACTIVITY*
Regional Sales Data and Condo Sales Data Not Seasonally Adjusted
| |
Median Price |
Percent Change in Price from Prior Month |
Percent Change in Price from Prior Year |
Percent Change in Sales from Prior Month |
Percent Change in Sales from Prior Year |
|
2-Apr 2002 |
2-Mar 2002 |
1-Apr 2001 |
2-Mar 2001 |
1-Apr 2000 |
| Statewide |
|
|
|
|
|
| Calif. (sf) |
$ 321,950 |
5.20% |
26.10% |
9.70% |
29.80% |
| Calif. (condo) |
$ 238,120 |
1.10% |
19.90% |
5.10% |
35.10% |
|
|
|
|
|
|
| Region |
|
|
|
|
|
| Central Valley |
$ 176,630 |
1.20% |
15.40% |
4.50% |
9.80% |
| High Desert |
$ 122,920 |
4.20% |
14.00% |
-1.00% |
13.40% |
| Los Angeles |
$ 274,460 |
2.90% |
21.10% |
11.80% |
26.50% |
| Monterey Region |
$ 431,550 |
-0.40% |
-0.10% |
9.50% |
50.00% |
| Monterey County |
$ 360,000 |
-1.80% |
6.00% |
4.80% |
46.10% |
| Santa Cruz County |
$ 494,000 |
-0.40% |
-6.80% |
15.60% |
55.60% |
| Northern California |
$ 227,600 |
3.00% |
14.00% |
4.10% |
21.80% |
| Northern Wine Country |
$ 368,350 |
2.80% |
9.80% |
5.80% |
36.70% |
| Orange County |
$ 392,610 |
3.40% |
11.20% |
4.00% |
30.00% |
| Palm Springs/Lower Desert |
$ 238,390 |
8.70% |
27.20% |
4.70% |
2.00% |
| Riverside/San Bernardino |
$ 165,710 |
-2.90% |
7.70% |
-6.90% |
1.90% |
| Sacramento |
$ 194,880 |
2.30% |
14.40% |
3.20% |
7.80% |
| San Diego |
$ 345,540 |
2.10% |
14.80% |
-2.20% |
28.70% |
| San Francisco Bay |
$ 529,940 |
4.40% |
9.50% |
16.20% |
72.90% |
| San Luis Obispo |
$ 306,920 |
-3.40% |
13.30% |
21.70% |
65.90% |
| Santa Barbara County |
$ 414,290 |
22.20% |
18.90% |
-8.80% |
9.80% |
| Santa Barbara South Coast |
$ 581,900 |
0.80% |
8.80% |
1.80% |
17.70% |
| North Santa Barbara County |
$ 238,090 |
0.60% |
21.70% |
-22.10% |
-1.00% |
| Santa Clara |
$ 552,250 |
3.20% |
4.20% |
11.30% |
118.80% |
| Ventura |
$ 355,080 |
5.60% |
18.10% |
2.30% |
46.80% |
* Based on closed escrow sales of singlefamily, detached homes
only (no condos). Reported monthtomonth changes in sales activity may overstate actual changes because of the small
size of individual regional samples. Movements in sales prices should not be interpreted as measuring changes in the
cost of a standard home. Prices are influenced by changes in cost and changes in the characteristics and size of homes
actually sold.
** Due to the small sample size in these areas, prices and
activity changes may be overemphasized.
sf = singlefamily, detached home
Median Prices By Region - Current Month vs. Year Ago
|
2-Apr 2002 |
2-Mar 2002 |
1-Apr 2001 |
|
| Statewide |
|
|
|
|
| Calif. (sf) |
$ 321,950 |
$
305,970 |
$ 255,310 |
r |
| Calif. (condo) |
$ 238,120 |
$
235,520 |
$ 198,620 |
r |
|
|
|
|
|
| Region |
|
|
|
|
| Central Valley |
$ 176,630 |
$
174,610 |
$ 153,060 |
r |
| High Desert |
$ 122,920 |
$
117,920 |
$ 107,860 |
r |
| Los Angeles |
$ 274,460 |
$
266,830 |
$ 226,640 |
|
| Monterey Region |
$ 431,550 |
$
433,330 |
$ 432,000 |
|
| Monterey County |
$ 360,000 |
$
366,620 |
$ 339,500 |
|
| Santa Cruz County |
$ 494,000 |
$
496,000 |
$ 530,000 |
|
| Northern California |
$ 227,600 |
$
220,970 |
$ 199,730 |
|
| Northern Wine Country |
$ 368,350 |
$
358,210 |
$ 335,580 |
r |
| Orange County |
$ 392,610 |
$
379,760 |
$ 352,930 |
|
| Palm Springs/Lower Desert |
$ 238,390 |
$
219,230 |
$ 187,380 |
|
| Riverside/San Bernardino |
$ 165,710 |
$
170,670 |
$ 153,900 |
|
| Sacramento |
$ 194,880 |
$
190,570 |
$ 170,420 |
r |
| San Diego |
$ 345,540 |
$
338,410 |
$ 300,940 |
|
| San Francisco Bay |
$ 529,940 |
$
507,530 |
$ 483,850 |
|
| San Luis Obispo |
$ 306,920 |
$
317,650 |
$ 270,970 |
r |
| Santa Barbara County |
$ 414,290 |
$
339,130 |
$ 348,330 |
r |
| Santa Barbara South Coast |
$ 581,900 |
$
577,430 |
$ 534,720 |
|
| North Santa Barbara County |
$ 238,090 |
$
236,610 |
$ 195,620 |
r |
| Santa Clara |
$ 552,250 |
$
535,000 |
$ 530,000 |
|
| Ventura |
$ 355,080 |
$
336,340 |
$ 300,640 |
|
r - revised
|
|
|
|
|
Carmel/Pebble Beach |
$882,250 |
| Pacific Palisades |
$867,500 |
| Malibu |
$840,000 |
| Palos Verdes Estates |
$835,000 |
| Burlingame |
$790,000 |
| Manhattan Beach |
$744,000 |
| Beverly Hills |
$742,000 |
| San Marino |
$730,000 |
| La Jolla |
$727,500 |
| Millbrae |
$712,500 |
|
|
|
|
|
|
|